
By Madison Karas
Earlier last year, Tiny News Collective announced the development of a data and metrics program, now called Tiny Vitals Metrics Lab, for early-stage news publishers. Since then, we’ve been working with a group of members and our partner Datasketch to build custom dashboards that integrate web and newsletter metrics, financial, operational and impact data. We are grateful for the generous support from the Patrick J. McGovern Foundation for this program.
Community-centered indie publishers need tools and support to track their metrics, yet few resources exist that are accessible or applicable to this sector of the field. Oftentimes, publishers are patching together their data, juggling too much to track metrics regularly, and only assess this information when a grant report is due.
That’s why we wanted to build something that was right-sized and meaningful for our members: a tool that includes business growth data they need to understand the health of their organization. That includes donations, grants, revenue and/or newsletter traffic — and impact metrics to ensure their reporting or products are achieving their intended impact. And we’ve learned that tracking growth and impact need to go hand in hand. Publishers need to show that they have reached more people and garnered support while also helping change culture, bring about important new policies or help shine light on injustices, not just one or the other.
We focused on including metrics representing what happens both inside and outside of a newsroom’s operations — like a story going viral and equipping a new population of residents to vote. When researching key metrics for early-stage news publishers, we landed on two primary sets of data (which you can read more about here):
These metrics informed our data dashboard design and structure, which we call the Tiny Vitals Tracker, leading us to integrate data from sources that were both quantitative from metrics programs and qualitative from manual tracking. These metrics also informed the naming of our program, as terms like Key Performance Indicators fall short in conveying how vital both types of data are as measurements for an organization’s sustainability. Additionally, as we thought about the origins of this data, coming from sources inside and outside an organization, we were reminded of how parallel sectors use the concept of “vitals” to monitor indicators in health, environment, infrastructure and logistics.
As we created this prototype with our members, it became clear that Tiny News publishers approach their organization’s data in a distinct way. Our members can illustrate their organization’s relationship with their communities using multiple types of data in a more intimate and personal way than larger news organizations. That’s partially because they have a more direct relationship with the people who are behind their data (audience, donors, members or subscribers), but also because they understand the importance of the interplay between these two categories of metrics: data to assess organizational health and areas for growth, and impact metrics to assess their mission and progress.
We believe the difference between how we use and talk about growth and impact metrics has significant implications for the journalism industry as it reckons with unreliable big-tech distribution and political polarization. First, we want to highlight some key learnings from piloting Tiny Vitals with small, indie publishers:
More than just learning the definitions of digital analytics to regurgitate them, holistic data literacy requires building confidence in the practice of metrics collection and sharing. When joining our program, publishers came in with varying knowledge on communicating their metrics to different stakeholders, identifying opportunities to track data, and understanding how various data is structured.
The actual data varies considerably in what it looks like and means from a newsroom’s different products and platforms, as well as how their audiences are represented in it, and each requires context to interpret. For example, pick-up rates, click-through rates and completion rates are all product-specific conversion metrics that all have their own margins of error. Bringing all of them together to create a picture of “success” can feel like mixing oil and water. With only fragments of this knowledge, early-stage publishers are at risk of making choices that lead to data debt, where they don’t have historical data to make informed decisions about their growth. A common example of that is not having early fundraising data available to plan larger donor campaigns later. Early holistic data literacy gives publishers the agency to make active choices about how to grow over time and prioritize products and coverage areas. It can also help them decide what to stop doing.
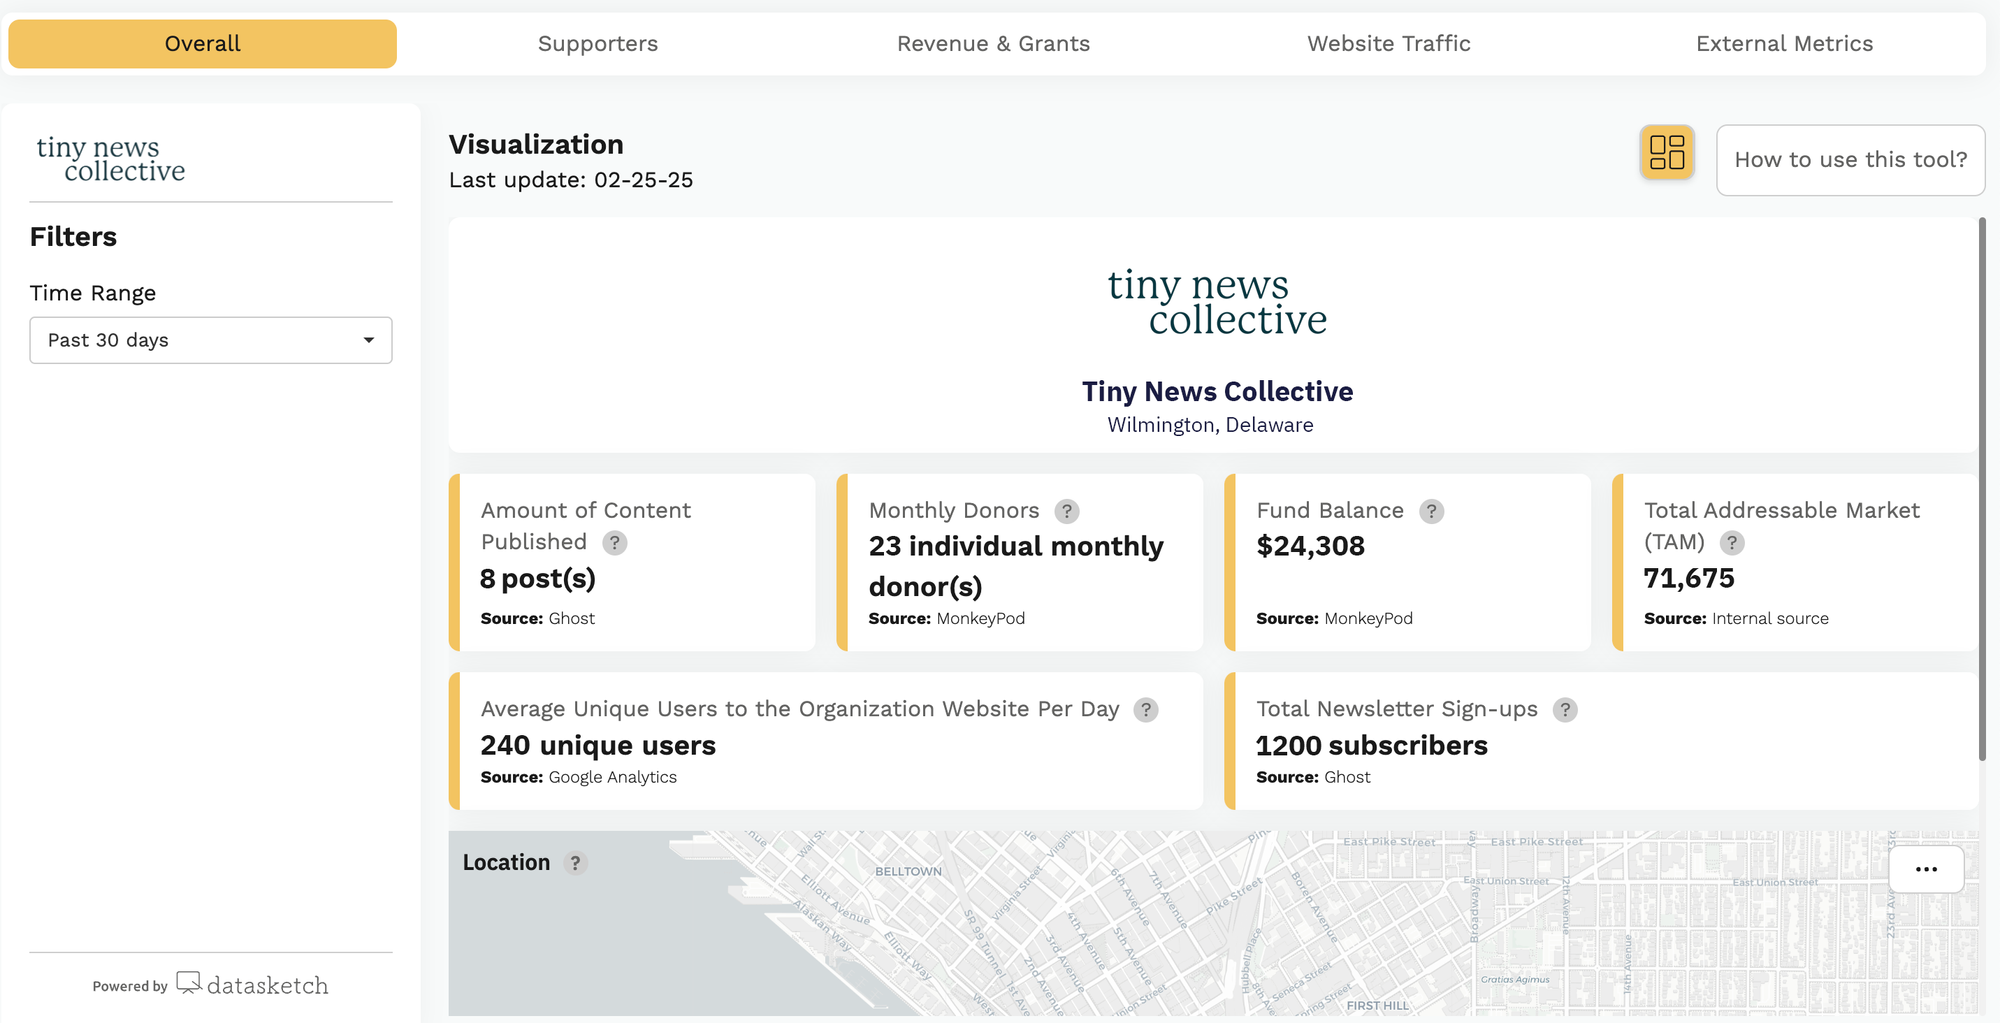
Dashboards with north star metrics that may incorporate multiple sources are used in some newsrooms, but analytics software used by larger newsrooms typically focus on one or two sources or present vast amounts of data in siloed ways. Our Tiny Vitals Tracker focuses on bringing together data of key metrics we identified from analytics software for website, newsletter and financial data and manually collected and tracked impact data.
Our prototype dashboard includes access to the full datasets from each source, but we’ve found it valuable for time-strapped founders to see just these focus metrics in a dashboard view. That encourages quicker understanding and storytelling of the data and saves a solopreneur from having to click into five-plus platforms to gauge their organization’s health.
Both members who had experience with analytics platforms and those who didn’t felt positive about viewing their data on an appropriate scale for their organization’s size and stage of growth. Now that these publishers can access these data in one place, we have more work to do to illustrate the relationship between data from different sources within the dashboard. That is especially true in relation to impact data. But overall, we and our member-publishers have found this presentation of the dashboard to be a great start.

Not long ago, the journalism industry started using impact metrics out of a need to communicate the effects and change that their work produces. The science of journalism’s adoption of these is still being developed. Mission-based news is growing, yet newsrooms are increasingly producing content in the same way tech companies do — focusing exclusively on scale and more content with mass appeal. At the same time, newsrooms are also being compelled to integrate impact metrics from the academic, arts and social sectors. In recent years, the need for that integration has become more immediate as newsrooms are challenged from multiple sectors (politically, philanthropically, etc.) to give evidence for their substantive value. And for small, independent organizations embedded so closely within their communities (especially ones historically harmed or underserved), the need to create impact metrics is more immediate.
To help them get started, we provided members with impact metrics for externally sourced data — media mentions, event appearances and editorial impacts — that we encouraged them to customize to their organization’s mission and products. We also asked them to record data of their total addressable market (TAM) using data from their community. Identifying their TAM using datasets from their community was a first step to adapting the standard metric used for startup market sizing. Helping organizations determine their TAM has prompted valuable discussions with founders to define who in their community they intend to serve on a more granular level. Through this effort, they are gaining a clearer picture of who their audiences really are, which will help them understand where there might be gaps in serving them.
Helping members identify, classify and record this type of data prompted big questions:
These questions require more exploration. But once publishers understand the foundational concepts, they do not lack impact data to track. We’re still figuring out how to support them in routinely identifying and tracking this data as it happens. For example, we shared examples of impact with publishers in our pilot — such as supportive LinkedIn responses from community members after engaging with the news outlet — and encouraged them to think about these events as part of their organization’s overall impact. These discussions with pilot members created a lot of “aha moments.”

Too often, we see new journalism ventures make “mission accomplished” claims using exclusively growth-focused metrics as supporting evidence.
Scaling your reach in a community and creating material change in it are not the same thing. However, being able to measure growth, health and impact is important to guide an organization’s path to sustainability and priorities within its community. Our program’s early learnings affirm that these metrics are complements, not substitutes; in other words, they can be used well together but not in place of one another.
Think of it this way: The journalism industry has been treating growth and impact like margarine and butter, but they are more like peanut butter and jelly. Receiving $100,000 in funding or reaching 10,000 page views does not have the same value as helping someone make an informed vote or changing their view of their neighbor. Doing both together is what makes a product indispensable.
In journalism, communities need more than newsrooms that produce content with no impact. A prime example of that is when outlets renamed their local news coverage as “democracy beats”; the reporting did little to help readers actively participate in their local government. The new content got out into the world but didn’t accomplish its intended result. That’s why both are needed. Tracking and making sense of data alongside impact metrics can hold our own practices to account and actually communicate our value and why we exist to others. It’s no longer sufficient to default to repeating abstract or poorly aged Fourth Estate slogans to justify doing journalism (e.g., Democracy dies in darkness).
There’s growing momentum across media and tech that asks us to define and communicate who we are and what we do differently that requires new measurement approaches. For example, look at those who advocate for the future of news to be established as a public utility rather than the preservation of “journalism,” or the challenges to Big Data’s fate pressuring our industry to put less is more into practice and define new metrics altogether. All that is happening as our audiences collectively suffer information overconsumption and oversaturation fatigue on digital platforms that all news organizations, regardless of size, try to penetrate through.
Differentiating which metrics the journalism industry uses to communicate success for things like size, scale and support, and those we use for an organization’s impacts and outcomes in communities benefits everybody: newsrooms of all sizes and their audiences. Consequently, if we as an industry stop prioritizing growth exclusively, it will help retain the people and organizations we want to succeed the most: the community-focused changemakers.
Making room for both is a mutually beneficial practice for newsrooms and audiences because it helps us evaluate and justify our purpose to be in our communities. Tiny publishers innately know that and need help putting it into practice.
As for what’s next for the Tiny Vitals Metrics Lab, our tiny publishers are asking us for more support and ways to track the volume and relationship between these two types of metrics: the internal and external, the growth, health and impact, the quantitative and the qualitative. We’ll keep you updated on the ways we do that.
Madison Karas is a contract product manager and project manager for R&D at the Tiny News Collective. Andrea Faye Hart played a role in shaping this article, and Amy L. Kovac-Ashley and Mark Glaser edited it.
Sign up for our monthly newsletter for ongoing updates, announcements, and resources for newsroom entrepreneurs.